Table of Contents
- Introduction
- The Initial Situation: Why We Had to Act
- The Journey: From Requirements to Production
- The Payoff - And What’s Next
Introduction
Last summer, our re-platforming initiative gave us the perfect window to tackle a problem that had been quietly eroding our engineering velocity: observability. Or rather, the complete lack of it.
Observability, in essence, is the ability to understand what’s happening inside your systems by examining their outputs. When done right, observability transforms debugging from archaeological excavation into surgical precision. When done wrong (or not done at all) every production incident mobilizes several engineers in a multi-hour guessing-game.
We were firmly in the latter camp. And we decided to fix it.
This post chronicles our journey: the chaos we started from, the constraints we navigated, the solutions we evaluated, and the stack we ultimately built.
The Initial Situation: Why We Had to Act
For years, we relied on Docker logs for observability and Slack for alerting (a notification for every error), delivered straight to a channel. As long as we were small, this was good enough. A few services, a few engineers, modest traffic. But as we grew, it became completely unsustainable.
Slack as a Monitoring System
The implementation in our codebase was as simple as that piece of code, scattered throughout the codebase:
try {
  // ...
} catch (error) {
  // This was literally our "monitoring infrastructure"
  await fetch(SLACK_WEBHOOK_URL, {
    method: 'POST',
    body: JSON.stringify({ text: `🚨 Error: ${error.message}` })
  });
}
And the result on our tracking channel:
🚨 Error in payment-service: Cannot read property 'id' of undefined
🚨 Error in payment-service: Cannot read property 'id' of undefined
🚨 Error in payment-service: Cannot read property 'id' of undefined
🚨 Error in user-service: Connection timeout
🚨 Error in payment-service: Cannot read property 'id' of undefined
This system had obvious drawbacks:
- Every single application error triggered a Slack notification. At scale, it just became white noise. The channel was permanently muted. Actual critical issues drowned in a sea of transient errors and retries. We had achieved the worst of both worlds: alert fatigue and missed incidents.
- Messages were not actionable without much deeper investigation. No traces. No correlation. No context. Just raw error messages screaming into the void.
- Absolute lack of robustness. What if the application had an issue at startup? What if the hook couldn’t be triggered for some reason? What if Slack experienced an outage, updated its API, or imposed stricter rate limits? We would be in the dark without even knowing something was wrong.
- No information on infrastructure. We only monitored (some) application errors. But for other critical services like databases, queuing systems, instances, or caches, we were never notified about errors - and that happened several times.
Docker Logs: Ephemeral and Inaccessible
For anything beyond errors, we relied on Docker’s native logging. This was marginally better than Slack (at least the logs contained actual detail) but it came with its own set of problems.
- Storage was ephemeral. Logs rotated based on Docker daemon configuration, typically clearing every few days. If you didn’t catch an issue within that window, the evidence was gone forever. The problem was even more painful on releases, as all logs were simply wiped out.
- Reading logs required SSH access to production infrastructure. Probably the most critical issue. It either meant granting access to all engineers so that everyone could work autonomously, with all the security risks that came with it; or having system administrators become the bottleneck, being the only ones able to extract the context needed to trace a bug back to its source. Neither option was acceptable long-term.
- Identifying and tracing bugs was a treasure hunt. Our “query language” was
docker logs | grep, which is exactly as primitive as it sounds. As we ran more instances of the same service and load-balanced them, it became increasingly complex to trace the full flow of operations for a given request. Each node stored its own logs with no aggregation, meaning you had to know which node handled a particular request before you could even begin investigating.
Hitting the wall
The cumulative effect of all this was a debugging experience that ranged from frustrating to impossible. We couldn’t search logs across all services — there was no central place to search. We couldn’t correlate requests across microservices — there were no trace IDs, no context propagation, no way to follow a request from ingress to database and back. We couldn’t detect error rate spikes because we only saw individual errors, not patterns. The more customers we onboarded, the more painful the problem got, to the point that we could no longer provide guarantees nor fix issues. By Q2 2025, about 40 unsolved infrastructure and application incidents were raised every week. Issues we couldn’t do anything about because we lacked sufficient information to reproduce them. We needed to break that vicious cycle as fast as possible.
The Journey: From Requirements to Production
Our first step was to clearly identify our real needs (present and future) and constraints. As a relatively small French startup, we had very different concerns and goals than larger companies located elsewhere in the world. Solutions designed for billion-dollar enterprises simply don’t fit companies our size.
- The timeline was aggressive: one 3-week sprint, one (almost) full-time engineer. No phased multi-quarter rollout. No dedicated platform team waiting in the wings. The product team was in the middle of delivering major features long awaited by some of our biggest customers, and we couldn’t afford to lose focus on that plan.
- Data sovereignty wasn’t negotiable. All data must be hosted in Europe on sovereign infrastructure. To make things harder, we are contractually engaged with some of our most important clients to not use big tech or US providers in any of our services, ruling out AWS, GCP, and Azure entirely.
- Data persistency also mandatory. To match our customers expectations, we needed to be able to trace any operation for the past 3 months, at least.
- Telemetry centralization and Access control were of course a no-brainer, for the reasons mentioned earlier.
- GDPR compliance added another layer: full anonymization of personally identifiable information, zero tolerance for credential leakage, and the ability to demonstrate data handling practices under audit. We needed a solution that could mask sensitive data before it ever left our services.
- Then there was the budget. We weren’t going to spend €500/month on observability when our entire infrastructure costs around €1,000. Our target: maximum 10% of infrastructure spend, which gave us roughly €100/month to work with.
- While we aimed for a comprehensive platform, long-term commitment was not an absolute necessity. Our business is still evolving quickly, as are our users’ needs. We’re still in an early phase, in a maturing market, and it’s hard to predict where we’ll stand in a year or two. We believe in not overthinking, and in balancing implementation time, costs, and complexity with short-term needs and constraints. Things change, and few companies keep the same stack over their entire lives. With that in mind, we prioritized how logs would be sent and stored over the dashboard used to view them.
- Finally, we needed seamless integration. No breaking changes to the existing codebase. No rewriting services from scratch. Whatever we built had to slide into our stack transparently and roll out progressively, service by service, without disrupting our release cycles.
These constraints immediately eliminated most of the obvious choices. But constraints breed creativity!
We adopted a three-phase approach:
- Define the format: establish how we would structure and emit telemetry data before worrying about where it would go.
- Choose the platform: evaluate solutions against our constraints, run POCs, and pick a winner.
- Instrument progressively: roll out observability service by service without disrupting our regular release cycles, proving value incrementally rather than betting everything on a big-bang deployment.
Phase 1 - Telemetry format
Before evaluating platforms, we needed to answer a fundamental question: how should we emit telemetry data so that it’s actually usable by our engineering team? Unstructured logs become increasingly difficult to analyze as traffic grows. We needed a better approach: logs that could be correlated across all microservices, containing the exact information required to reproduce issues and detect performance bottlenecks.
Discovering OpenTelemetry
Our research quickly led us to OpenTelemetry (OTel), the CNCF project that has become the de facto standard for observability instrumentation. OTel provides a unified data model for logs, traces, and metrics; vendor-neutral instrumentation that works with any backend (so you’re never locked in); language-specific SDKs for automatic instrumentation of common frameworks and libraries; and a collector component for processing, batching, and routing telemetry data before it hits your storage backend.
It rests on three pillars: logs (discrete events that tell you what happened), traces (connected cascading sequences called spans that show you how it happened across services), and metrics (aggregated measurements that reveal how well it’s happening). Each pillar provides a different lens on system behavior, and together they give you the complete picture you need to operate production infrastructure with confidence.
Combining this information with the right instrumentation and a proper visualization platform would give us an extremely efficient way to analyze and forensically examine logs and issues, track performance, and ensure reproducibility. It precisely matched our needs and constituted a great foundation for the next phase.
Why We Chose Manual Instrumentation
OpenTelemetry offers automatic instrumentation SDKs that can instrument your application with zero code changes. Point the SDK at your application, enable the relevant plugins, and it automatically captures HTTP requests, database queries, cache operations, everything. Sounds perfect, right?
We decided against it, for reasons that became clear during our initial experiments.
Retrofitting was the first and foremost important concern. We have an existing logging abstraction that our codebase already uses consistently. Every service calls our logging functions; every engineer knows the interface. Extending that existing abstraction to emit OTel data is far simpler than replacing it entirely and retraining the team on new patterns. The native OTel SDK requires to be imported pretty much everywhere in the codebase if a span needs to be created, or a metric emitted. This goes against our services and dependencies structuration.
So we extended our existing Telemetry class to offer additional OpenTelemetry features while maintaining backward compatibility with our existing logging interface:
import { trace, context, SpanStatusCode } from '@opentelemetry/api';
import { OTLPTraceExporter } from '@opentelemetry/exporter-trace-otlp-http';

export class Telemetry {
  private tracer = trace.getTracer('merciyanis-platform');
  private asyncStorage = new AsyncLocalStorage();

  // Overriding existing methods to send logs to the OTel
  // collector was pretty straightforward.
  info(message: string, attributes?: Record<string, unknown>): void {
    // Sending to OTel...
  }
  error(message: string, attributes?: Record<string, unknown>): void {
    // Sending to OTel...
  }

  // Simplified version of the span implementation.
  public span<T = unknown>(
    name: string,
    options: any,
    callback: (span: OpenTelemetrySpan) => T,
  ): T {
    const store = this.asyncStorage.getStore();
    const context = opentelemetry.trace.setSpan(opentelemetry.context.active(), store.span)
    const span = this.otelTracer.startSpan(name, options, context);
    return this.asyncStorage.run({ span }, (): T => {
      let callbackResponse;
      try {
        callbackResponse = callback();
      } catch (error) {
        // Mark span as errored, and so on...
        throw error;
      } finally {
        span.end();
      }
    });
  }
}
With this abstraction, instrumenting a project became trivial. The existing codebase worked as-is, while adding metrics and spans could be implemented afterwards:
// Existing code.
logger.info('Processing order', { orderId });

// Further instrumentation (instead of just calling `processOrder();`).
await logger.startSpan('processOrder', processOrder);
The key insight: one class, one import, ten minutes to instrument a repository. This enabled progressive rollout without disrupting our release cycles.
Anonymization was the second concern — and a critical one. We needed to intercept and sanitize data before it left our services: remove or hash PII, strip authorization headers, mask sensitive request parameters. Auto-instrumentation captures data as it flows through your application, but it doesn’t provide clean hooks for sanitizing that data before emission. We would have needed to bolt on post-processing in the collector, which felt fragile and error-prone. Here again, extending our existing classes proved to be the simplest and safest approach, giving developers maximum flexibility to implement security measures at the source.
Performance was the final consideration. The automatic instrumentation for Node.js relies on patching core modules and async hooks to intercept operations and generate proper trace spans. This introduces measurable overhead. Not catastrophic, but noticeable. For high-throughput services processing thousands of requests per second (the order of magnitude we currently handle), the cumulative impact on memory, latency, and CPU utilization could hurt services availability and user experience. We needed to surgically fine-tune the instrumentation to strike the right balance between comprehensiveness and performance.
Phase 2 - The Right Platform
With our instrumentation strategy defined, we needed a platform that could ingest OpenTelemetry data natively. We evaluated seven solutions against our constraints, spending roughly a week on research and POCs before making our final decision.
Datadog is the 800-pound gorilla of observability: polished UI, excellent OTel support, a comprehensive feature set that covers everything from APM to security monitoring to cost management. Their documentation is exhaustive, their integrations are endless, and their product is genuinely excellent. But Datadog is SaaS-only, hosted primarily on AWS (breaking our constraints), and priced for enterprises with enterprise budgets. At our projected log volume, we estimated several thousand euros per month. A prohibitive amount justified by the vast feature set the platform offers, but features we simply don’t need at our scale.
New Relic told a similar story with slightly different numbers. Full OTel support, a generous free tier (100 GB/month of data ingest), and a modern UI that contains a lot of precious features. But like Datadog, data storage location was a no-go for us.
Sentry was a serious candidate. It has improved dramatically over the years, growing from a specialized error-tracking platform to a fully-featured observability platform that natively handles logs, traces, metrics, errors, integrations, session replays, and more. Too bad it uses GCP as its main infrastructure provider.
The Elastic Stack (Elasticsearch, Logstash, Kibana—collectively known as ELK) has been the default choice for self-hosted logging for over a decade. The ecosystem is mature, the community is massive, and Kibana’s visualization capabilities are truly powerful. It’s fully self-hostable, and Elastic offers official Docker images and Helm charts that make deployment straightforward. The only downside is its relative complexity to set up. ELK is operationally heavy. From fine-tuning Elasticsearch to deploying and managing dashboards, the effort is considerable. For a team with dedicated platform engineers, ELK can be an excellent choice. For a small product team trying to ship features while also managing infrastructure, the operational burden was too high.
The same goes for the Grafana Stack (Loki, Tempo, Prometheus, Grafana). It meant more moving parts than we could confidently maintain.
This is where things got interesting. A new generation of observability platforms has emerged in the last few years, built from the ground up on OpenTelemetry for data collection and ClickHouse for storage.
SigNoz checked every box on our requirements list. It’s fully open-source. It’s OTel-native, ingesting traces, metrics, and logs through standard OTel protocols without any translation layer. It’s self-hostable via Docker Compose for small deployments or Kubernetes with Helm for larger ones. The UI provides a unified view of logs, traces, and metrics with end-to-end correlation: click on a trace span and see the associated logs, click on a log line and jump to the parent trace. Query performance is excellent thanks to the ClickHouse backend, which handles the high-cardinality data that observability generates.
HyperDX shares the same ClickHouse foundation as SigNoz and the same OTel-native approach, but with an even stronger focus on simplicity. The entire stack - frontend, API, ClickHouse, OTel collector — deploys from a single Docker Compose file with sensible defaults. The UI feels remarkably intuitive, clearly designed by people who’ve spent hours debugging production issues and got frustrated with the friction in existing tools. Dashboards, alerting, access control, all built-in, all working out of the box, all configured through a clean web interface. Last but not least, HyperDX was acquired by ClickHouse in March to create ClickStack, giving us confidence in its long-term viability.
Why HyperDX Won
For a week, we deployed and ran several prototypes, ingesting fake telemetry data at roughly 5× our current scale, and experimented with both SigNoz and HyperDX. HyperDX seriously impressed us. Even the most complex queries executed in milliseconds. No sign of backpressure. The UX was seamless. The Event Patterns feature is a standout. The end-to-end correlations between session replays, traces, logs, and infrastructure metrics make it remarkably easy to navigate through errors and events and finding the root cause in seconds. The fact that it runs on ClickHouse is a huge benefit in terms of cost and raw performance. Deployment simplicity also played a role: the entire stack deploys from a single command:
docker run -p 4318:4318 -p 4317:4317 -p 8080:8080 -p 8123:8123 docker.hyperdx.io/hyperdx/hyperdx-local:2-betaThat’s it. No Kubernetes. No Helm charts. No cluster management. No JVM heap tuning. For data persistency, robustness and high-availability, it is of course necessary to adapt the configuration and externalize some services, but even with that in mind, for a small team without dedicated DevOps resources, this simplicity is worth its weight in gold.
HyperDX speaks OpenTelemetry natively. There is no need for adapters or format transformations. Our Telemetry class sends data directly to the OTel HTTP endpoint, and it just works. There’s something deeply satisfying about pointing your application at a single URL and immediately seeing traces appear in your dashboard.
Finally, cost. At our current scale (~40 GB logs/month with 3-month retention), our total cost to run a HyperDX instance and its associated databases is approximately $30–40/month. Compare that to Datadog’s pricing. The difference isn’t marginal, it’s an order of magnitude. We’re spending less on observability than most teams spend on coffee.
Phase 3 - Deploying The Stack And Instrumenting Our Codebase
With HyperDX validated, we began rolling out instrumentation across our services. We adopted a progressive approach, prioritizing the services where observability would have the highest impact. Average time per service: 10–15 minutes for basic instrumentation that captures logs and request-level traces. Add another 1–2 hours if you want comprehensive tracing of critical paths with detailed span attributes. Most services fell into the “basic instrumentation” category initially, with deeper instrumentation added iteratively as we identified gaps. But that was just the application side.
Architecture Overview
We also needed to deploy the final observability infrastructure. One that would provide guarantees around reliability, availability, and durability. This stack is hosted on a dedicated instance in our production cluster so that potential resources consumption spikes don’t affect running applications and services. Our production setup looks like this:
┌─────────────────────────────────────────────────────────────────────┐
│                        Application Layer                            │
│  ┌──────────┐  ┌────────────┐  ┌───────────┐  ┌───────────┐         |
│  │ Service A │  │ Service B │  │ Service C │  │ Service D │         │
│  └─────┬─────┘  └─────┬─────┘  └─────┬─────┘  └─────┬─────┘         │
│        │              │              │              │               │
│        └──────────────┴──────────────┴──────────────┘               │
│                               │                                     │
│                               ▼                                     │
│                    ┌────────────────────┐                           │
│                    │  OTel Collector    │ ◄─── Batching, Sampling   │
│                    │  (Processor)       │                           │
│                    └─────────┬──────────┘                           │
└──────────────────────────────┼──────────────────────────────────────┘
                               │
                               ▼
┌──────────────────────────────────────────────────────────────────────┐
│                     Observability Layer                              │
│                                                                      │
│  ┌─────────────────┐      ┌─────────────────┐                        │
│  │  OTel Gateway   │─────►│   ClickHouse    │                        │
│  │  (Collector)    │      │   (Storage)     │                        │
│  └─────────────────┘      └────────┬────────┘                        │
│                                    │                                 │
│                                    ▼                                 │
│                           ┌─────────────────┐                        │
│                           │    HyperDX      │ ◄─── Dashboards,       │
│                           │    (Frontend)   │      Alerts, Search    │
│                           └─────────────────┘                        │
│                                                                      │
│  ┌─────────────────┐                                                 │
│  │   Prometheus    │ ◄─── Monitoring the monitoring                  │
│  │   (Meta-monitor)│                                                 │
│  └─────────────────┘                                                 │
└──────────────────────────────────────────────────────────────────────┘
                               │
                               ▼
┌──────────────────────────────────────────────────────────────────────┐
│                      External Monitoring                             │
│                                                                      │
│  ┌─────────────────┐      ┌─────────────────┐                        │
│  │  Uptime Robot   │      │     Slack       │                        │
│  │  (External SLA) │      │   (Alerts)      │                        │
│  └─────────────────┘      └─────────────────┘                        │
└──────────────────────────────────────────────────────────────────────┘
You may notice a few important considerations:
- We use Docker Compose to deploy all services as one project
- No Kafka instance acts as a buffer between the OTel gateway and the storage system
- Only one instance of each observability microservice is deployed (no load balancing, no horizontal scaling)
- Database instances (ClickHouse and MongoDB) are deployed locally on the same node with no specific redundancy, attached to an elastic volume
Although these points might sound alarming in terms of resiliency, robustness, and availability, one of our priorities was to keep things as simple as possible: reducing moving parts, minimizing components to maintain, and avoiding complex deployments. We’re not comfortable keeping things as-is for the long term and plan to strengthen this architecture in the future, but it was a solid start that already provides good guarantees. In the rare case of an outage on this node, we can easily spin up another one and redeploy the stack in less than 5 minutes. That’s enough for our needs.
Here is a simplified version of our Compose file:
# docker-compose.yaml
services:

  # MongoDB database instance used by HyperDX
  mongodb:
    image: mongo:5.0.14-focal
    volumes:
      - ./volumes/mongodb:/data/db

  # ClickHouse database instance used by OTel gateway and HyperDX
  ch-server:
    image: clickhouse/clickhouse-server:24-alpine
    volumes:
      - ./volumes/ch_data:/var/lib/clickhouse
      - ./volumes/ch_logs:/var/log/clickhouse-server

  # Receives all the telemetry data sent by the applications and services
  otel-gateway:
    image: docker.hyperdx.io/hyperdx/hyperdx-otel-collector:2.1.2
    depends_on:
      - ch-server

  # Actual HyperDX application instance
  app:
    image: docker.hyperdx.io/hyperdx/hyperdx:latest
    depends_on:
      - ch-server
      - mongodb

  # OTel collector that emits infrastructure-related metrics (CPU, memory, network, ...)
  otel-host-collector:
    image: otel/opentelemetry-collector-contrib:latest
    depends_on:
      - otel-gateway

  # Prometheus instance in charge of watching the observability node itself, detecting backpressure
  prometheus:
    image: prom/prometheus:latest
    depends_on:
      - otel-gateway

  # Sends alerts to a dedicated Slack channel in case of an incident on the observability node
  alertmanager:
    image: prom/alertmanager:latest
    depends_on:
      - prometheus
Monitoring the Monitoring
If your observability platform goes down, how do you know?
We solved this with layers of redundancy, each watching the layer above it. Prometheus runs alongside our observability stack, scraping metrics from the OTel Collector and ClickHouse (queue depth, rejection rate, disk usage, memory pressure, query latency). When any of these metrics crosses a concerning threshold, Prometheus AlertManager sends notifications to Slack. If the collector starts rejecting logs or ClickHouse falls behind on ingestion, we know immediately.
But what if Prometheus itself goes down? Or the entire node hosting our observability stack? That’s where Uptime Robot comes in. It’s an external service, completely independent of our infrastructure, that watches our products and platforms in real time. If any healthcheck endpoint stops responding, Uptime Robot alerts us through a separate channel. It’s the observer outside the system, the dead man’s switch that catches the failure modes internal monitoring can’t see.
This three-part setup (OTel/HyperDX, Prometheus, and Uptime Robot) gives us enough redundancy to confidently run our production infrastructure at our current scale (which, again, is pretty moderate).
The Payoff - And What’s Next
Benefits
After six months of using this new system in production every day, we have witnessed very real benefits.
Time to issue reproduction has dramatically decreased. Identifying a bug’s root cause and being able to precisely reproduce it in the codebase now takes less than 5 minutes on average. This means resolving issues much faster in production. Our time to resolution has dropped significantly to less than 30 minutes on average for simple problems.
Our alerting system is much better and more tailored to our needs. We now trigger alerts based on patterns rather than individual events:
- Error rate spikes notify us when we’re seeing an unsual number of errors per minute sustained over 5 minutes. This catches real problems while ignoring the transient errors that are a normal part of any distributed system.
- Fatal errors and service restart failures page the on-call engineer immediately — these are always worth investigating.
- Infrastructure pressure alerts (CPU above 80%, memory above 85%, disk above 90%) give us early warning to scale before users notice degradation.
- Collector rejection rates alert us if our observability pipeline itself is dropping data — critical for maintaining trust in our monitoring.
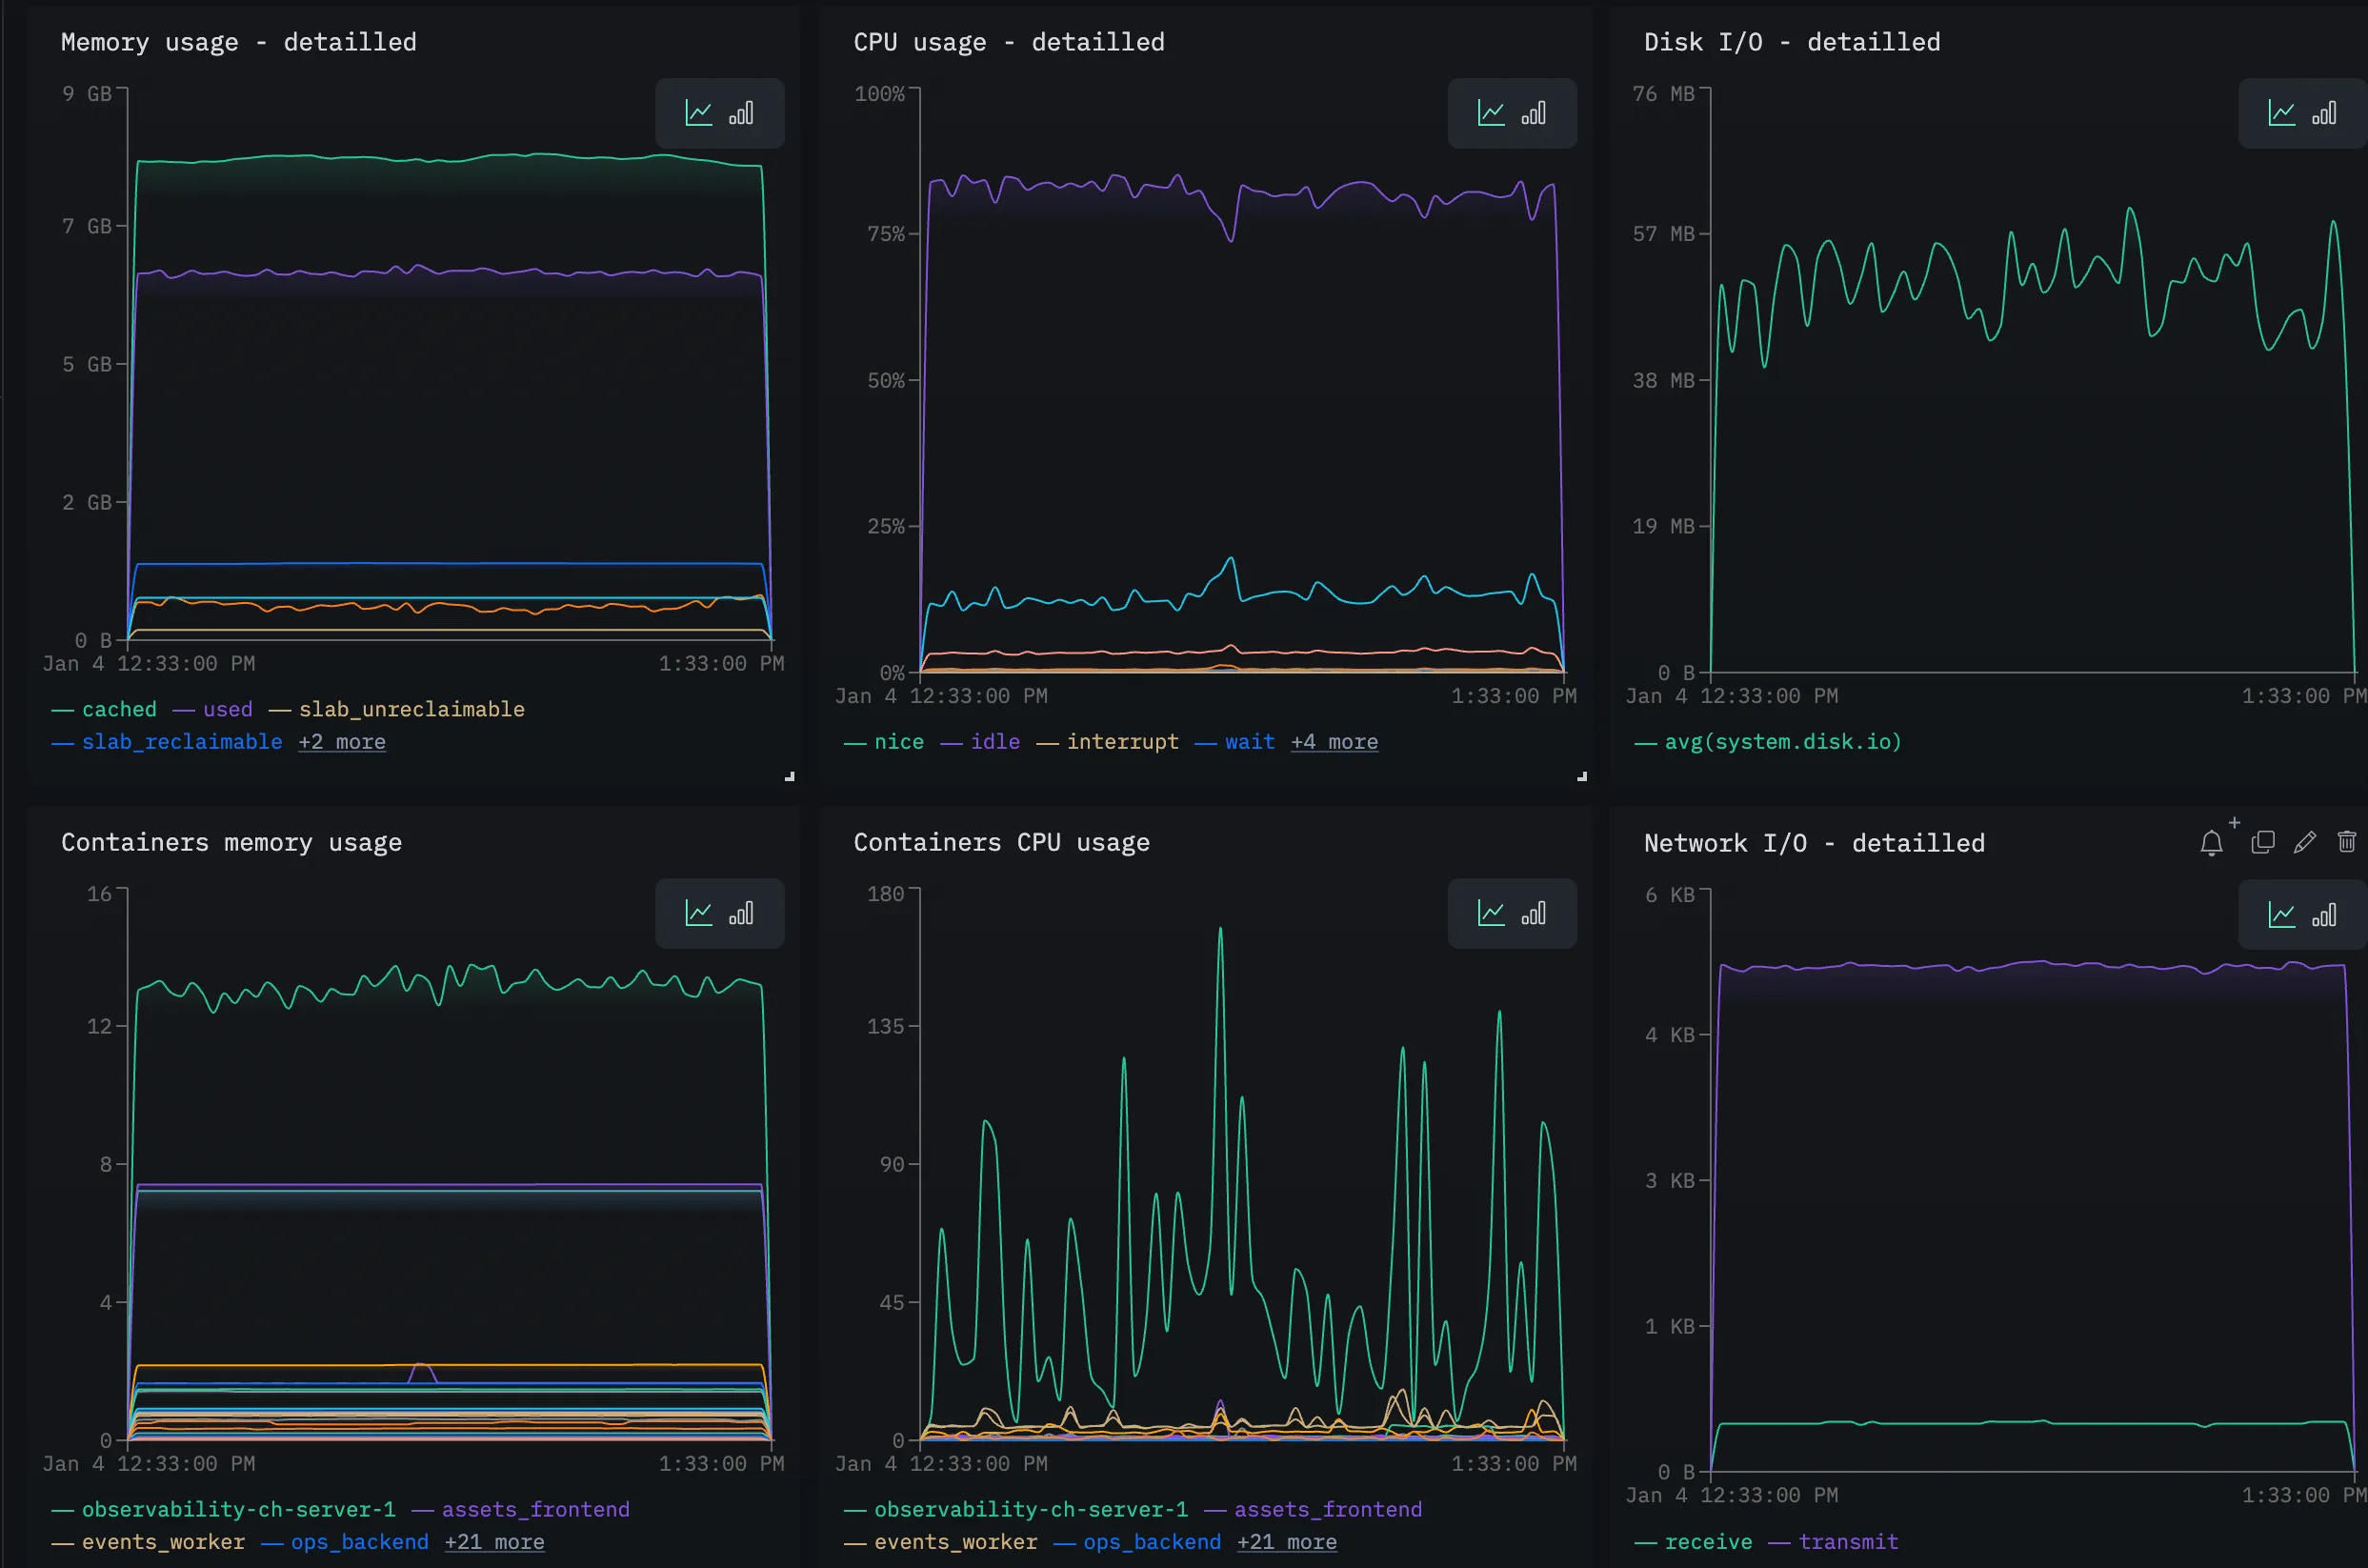
We also run a daily digest that summarizes total requests processed, error counts by service, p95 latencies by endpoint, and any anomalies detected overnight. Engineers check this each morning over coffee. It’s become a ritual that keeps everyone aware of system health without requiring active attention.
The result: 90% reduction in alert noise, with the remaining alerts being really actionable. Our Slack channel is no longer muted.
We can now anticipate instead of just reacting. With a larger retention period and a complete set of tools to analyze telemetry, we now have a much better understanding of what’s happening across the platform. We were able to spot valuable metrics indicating suboptimal processing in our backend, get a clear view of infrastructure health, and anticipate or prevent potential incidents before they occur. It also allows us to detect unexpected or abusive behaviors across our apps and take appropriate measures to mitigate them. In summary, we now have real ownership of our products. We’re also capable of providing useful data to our customers when they need it, like audit trails going back several weeks.
Autonomy for everyone, security at the core: today, every engineer can work and solve issues fully autonomously, without compromising security. Production access is still restricted to SysAdmins only, but engineers debug through HyperDX without needing external help. They can generate dashboards, set up alerts, monitor specific events… This new way of working is now deeply integrated into their habits.
The Road Ahead
Setting up this observability platform was undeniably a success, and we’re in a much better situation than we were last year. Nonetheless, we’re convinced it’s only the beginning of our journey, and we already have several areas in mind that need improvement. Here’s what we’re working on (or plan to tackle) in 2026.
Robustifying the Infrastructure
Our current deployment runs on a single node. We’re comfortable with this for now (it’s simple, it’s fast, and it meets our current needs) but we’re acutely aware of the risks. If that node fails, we lose observability until we can spin up another one. Even if the process is very easy and takes less than 5 minutes, it’s something that will get more and more critical and unacceptable as we grow.
We aim to set up a more resilient system, including at least ClickHouse database replicas and a high-availability, auto-scaling setup for the OTel collector and gateway. This will give us far stronger guarantees around robustness.
Improving Instrumentation Coverage
Not everything is instrumented yet, and we’re working to close the gaps.
All our application services are covered, and that’s a great starting point. However, some infrastructure and critical services (like our Kafka instance, Nginx servers, and caching systems) are minimally instrumented or not instrumented at all. This is a blind spot that, although not absolutely critical (because we still get data through clients services using them, plus hardware metrics), prevents us from getting the full picture of what’s happening during an incident.
Some services that are instrumented have what we’d call “minimum viable instrumentation”: they emit logs, but without enough context to be actually useful. We need more detailed database query tracing (the current spans tell us a query ran; they don’t tell us much about the query itself), better span attributes for business context (e.g., knowing what IoT payload was processed, not just that a payload was processed), and standardized attribute naming across teams (so resourceId in one service matches deviceId in another).
Frontend Instrumentation
Currently, our traces start at the API gateway. Everything that happens before the HTTP request — the user clicking a button, JavaScript execution, the browser forming the request — is almost invisible to us.
The product team uses PostHog as an analytics and insights platform, and it provides good details about user actions and flows. But even though it gives us some visibility, it means juggling multiple tools, doing detective work to match a frontend action to its backend equivalent, and losing time trying to reproduce issues. PostHog sampling makes things even harder when it comes to traces correlation.
Reducing False Positives
We still have noise in our alerts. Some “errors” aren’t really errors — they’re product configuration problems rather than technical incidents, expected retry patterns that we log at the wrong level, or third-party API timeouts that recover gracefully without user impact. Every false positive trains engineers to ignore alerts, which is dangerous.
We need better log level discipline (not every caught exception should be an ERROR), and we’re considering a “known issues” suppression mechanism that lets us temporarily silence alerts for issues we’re aware of and actively working on. The goal is that every alert that fires represents something worth investigating.
Conclusion
We went from “Slack notifications and prayer” to “production-grade observability” with reasonable effort, without disrupting product priorities, for $40/month.
The key enablers were OpenTelemetry as a vendor-neutral instrumentation standard (so we’re not locked into any particular backend), HyperDX and ClickHouse for cost-effective, high-performance storage and querying (the ClickHouse architecture is genuinely impressive for this use case), manual instrumentation for the control, performance, and retrofitting capabilities that auto-instrumentation couldn’t provide, and progressive rollout to prove value incrementally without betting everything on a risky big-bang deployment.
If you’re a small team drowning in production debugging, know that you don’t need a dedicated platform team or a six-figure observability budget. The barrier to entry has dropped dramatically in the last few years. Pick an OTel-native platform you can self-host. Build a thin abstraction layer so you can swap backends later if needed. Instrument your most painful service first - the one that generates the most customer complaints, the one that wakes you up at 3am. See the immediate value. Then expand from there.
The investment pays for itself the first time you diagnose a bug in 5 minutes instead of 5 hours. For us, that happened within the first week of production deployment. We’ve never looked back.
Questions about our observability setup? Want to discuss strategies for your own team? Reach out to us at engineering@merciyanis.com — we’re always happy to talk shop.